Who can hear your radio signal?
It is probably the most important question to programmers, listeners,
volunteers, staff, funders, and licensees.
LPFM Radio Impact Maps
are understandable, professionally styled FM radio coverage maps
with state-of-industry prediction accuracy,
population counts and demographics; designed
to be used instantly to answer questions and showcase your station.
Order Online Here
What you can do with LPFM Radio Impact Maps and Demographics
- Inform financial decisions with potential listener numbers and listener demographics.
- Appeal to funders with solid and attractive information.
- Target potential volunteers, staff, board members, listeners, and local underwriters.
- Choose programming relevant to your listeners.
- Use the attractive maps on station outreach, underwriting,
and identity/branding materials.
What you get
A PDF report containing:
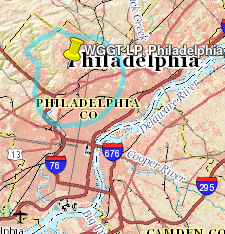
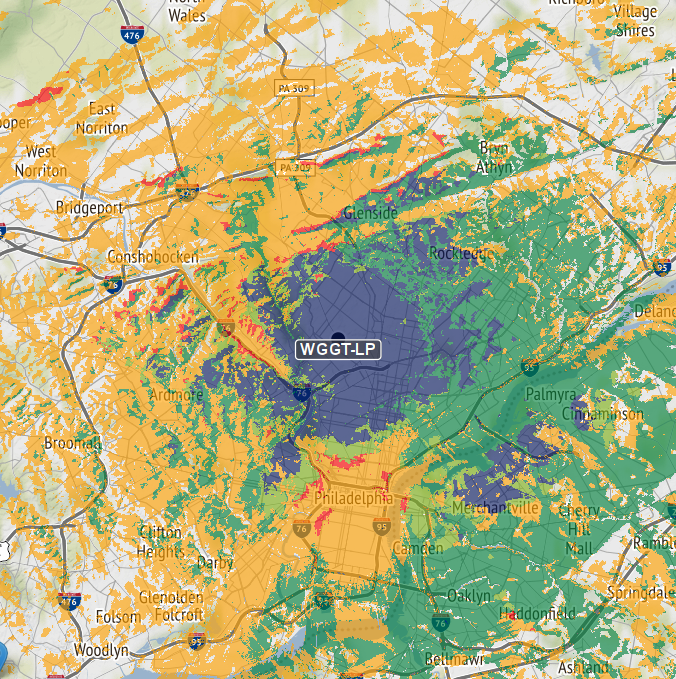
- High-resolution maps in three different styles for different purposes.
- Each map is on a separate print page,
to be easily pulled into other materials as
needed.
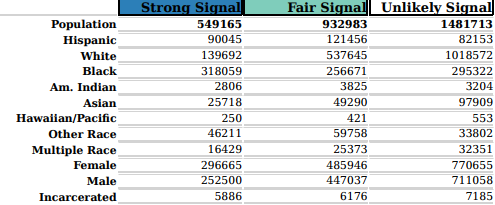
- Population totals and demographics corresponding to the maps.
- Technical explanations.
- A list of the stations potentially causing interference which
were considered when producing the map.
- A key so that Prometheus can reproduce the map in the future.
- Download a sample!
Who made this? Why should I trust it?
-
LPFM Radio Impact Maps are developed by us at the Prometheus Radio Project,
with partial funding from a Knight Foundation Prototype Grant.
We are a well-known
15-year-old nonprofit LPFM advocacy and service organization
with deep technical expertise and a mission and passion
to make LPFM radio stations successful.
We have a commitment to quality, so if there's a problem, we
work hard to correct it.
-
Radio signal strength is predicted with
the state-of-the-industry Longley-Rice ITM
mathematical model,
from source code posted by the FCC.
- Terrain data is sourced
from the U.S. Geological Survey (1-second seamless NED)
and processed in accordance with FCC guidelines.
- The Federal Communications Commission "CDBS" database of radio stations,
updated daily,
provides parameters of the station of interest and also of the
potentially-interfering stations.
- Population counts and demographics use
the United States Census Bureau's 2010 "SF1" census-block data.
How much does it Cost? How do I order?
One map with demographics for an existing LPFM (or class D) station costs $99, with discounts if we do additional work for that same station.
Order Online Here.
For maps of non-LPFM stations or "what if" situations, contact us with your station/request at support (at) prometheusradio (dot) org.
How do you compare to the free maps and others?
We are unaware of any free or low-cost on-line maps which incorporate interference, which strongly affects many LPFM stations' coverage.
-
Maps which use the FCC contour method handle terrain poorly and ignore interference, often over- and under-estimating LPFM coverage significantly.
- Better maps use Longley-Rice, but either ignore interference, thus overestimating many LPFM signals, use coarse terrain data, or are designed to be understood by engineers.
